

But despite that, average house prices held up across England – even if there was a drop in sales.
It was the same picture in Adur, where prices rose by 4.9 per cent in the year to September 2020. Across the South East, prices rose by 3.4 per cent.
The ONS also publishes house price figures by Middle Layer Super Output Areas (MSOAs) – small geographic areas containing an average of 7,200 people.
These show six of the eight MSOAs that make up Adur saw a rise in house prices over the same period.
Here we reveal which neighbourhoods saw the strongest growth in the year to September 2020.
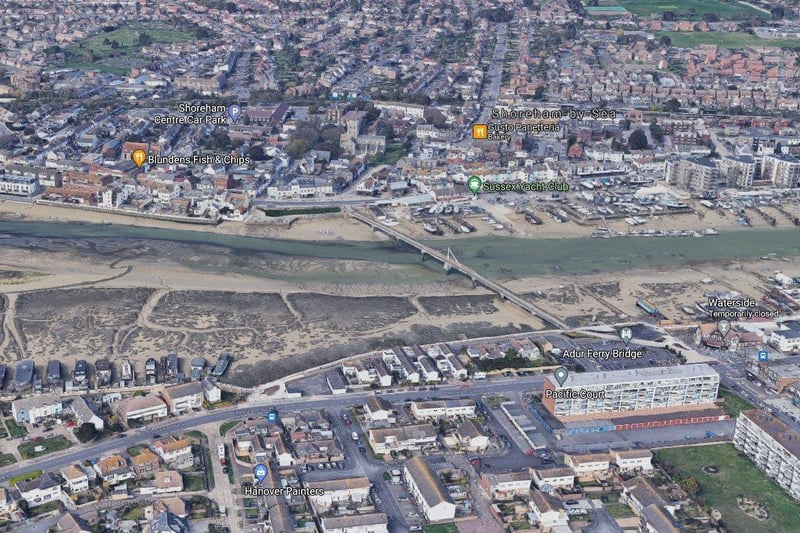
1. Shoreham Central and Beach
The biggest price increase was in Shoreham Central and Beach, where the average price rose to £421,481, up by 21.4% on the year to September 2019. Overall, 155 homes changed hands here between October 2019 and September 2020, a drop of 18%. Photo: Google
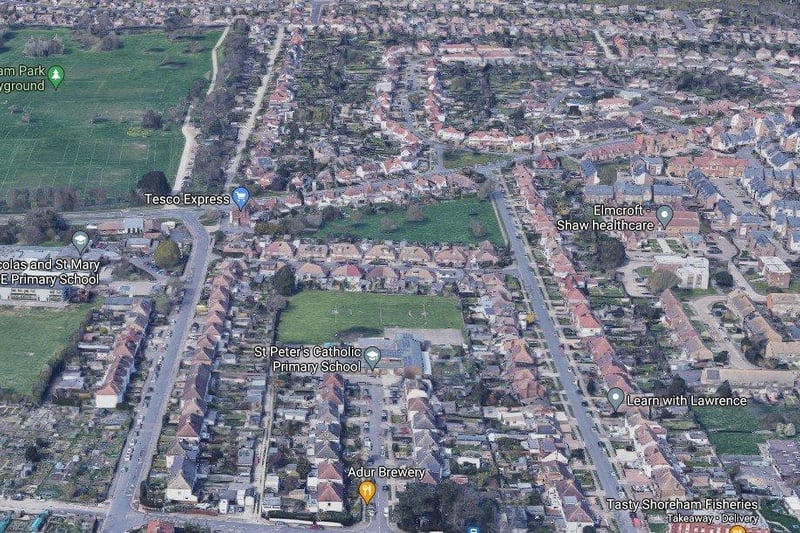
2. Buckingham
The second biggest price increase was in Buckingham, Shoreham, where the average price rose to £439,791, up by 4.6% on the year to September 2019. Overall, 90 homes changed hands here between October 2019 and September 2020, a drop of 24%. Photo: Google
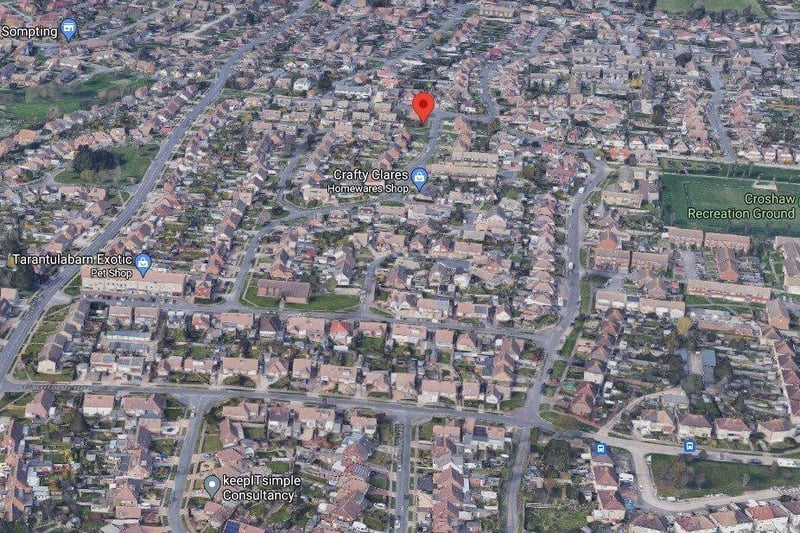
3. Cokeham and Sompting
The third biggest price increase was in Cokeham and Sompting, where the average price rose to £295,784, up by 3.5% on the year to September 2019. Overall, 90 homes changed hands here between October 2019 and September 2020, a drop of 4%. Photo: Google
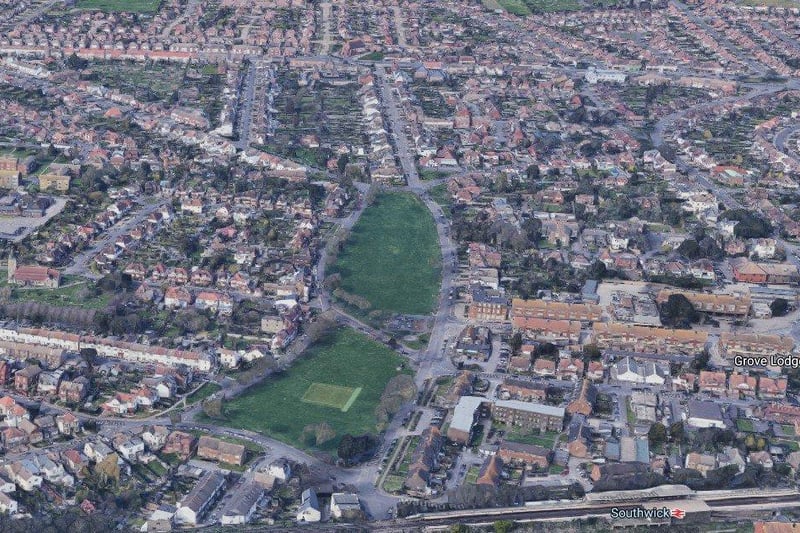
4. Kingston and Southwick
The fourth biggest price increase was in Kingston and Southwick, where the average price rose to £336,327, up by 3% on the year to September 2019. Overall, 95 homes changed hands here between October 2019 and September 2020, a drop of 21%. Photo: Google